
Flying Blind: What Your AI Agent Does When You're Not Looking
Your AI agent returns a confident answer that's completely wrong — and nothing alerts. Here's how to make agent behavior observable

Observability for AI agents — logs, traces, evaluation, and production monitoring.
Your agent returns a clean, confident, well-formatted answer. It's completely wrong. No exception is thrown. No alert fires. No status code goes red. The first person to find out is the customer who acted on it.
Now answer a few questions about that run. What exactly did the agent do, step by step? Which tool did it call, and what came back? How many tokens did it burn — and what did that cost you? How long did it take? Was the answer even correct?
If you can't answer those in under a minute without grepping raw log files, you're not really running an AI agent. You're hoping one works.
AI agents are no longer toys or demos. They answer customer questions, write and execute code, browse the web, call APIs, and coordinate with other agents to complete complex tasks. They are software — and like all software, they break. The difference is that when an AI agent breaks, you often don't know it. There's no stack trace pointing to line 42. The agent might return a confident answer that happens to be completely wrong. It might silently call the wrong tool seventeen times before timing out. It might slowly drain your API budget over a weekend while nobody is watching.
This is the observability problem for AI agents, and it's a harder version of a problem the software industry has spent years solving. This article starts with the failures you should be afraid of, shows why your existing monitoring won't catch them, and only then gets into what observability actually means for an agent: what to measure, how to measure it, and where to start.
Six questions you should be able to answer
Before any theory, a simple test. For any agent run in your system right now, can you answer the following — quickly, without reading raw logs?
- What did the user ask?
- What did the agent do, step by step?
- What did each tool call receive and return?
- How many tokens did the run consume, and what did it cost?
- How long did it take?
- Did the output look correct?
If you can answer all six, you are in a fundamentally better position than most teams running AI agents in production today. If you can't, the rest of this article is about how to get there — and why each gap is more dangerous than it looks.
When agents fail, they fail silently
Abstract arguments for observability are easy to dismiss. Concrete failure scenarios are harder to ignore. Here are five that happen in real production systems.
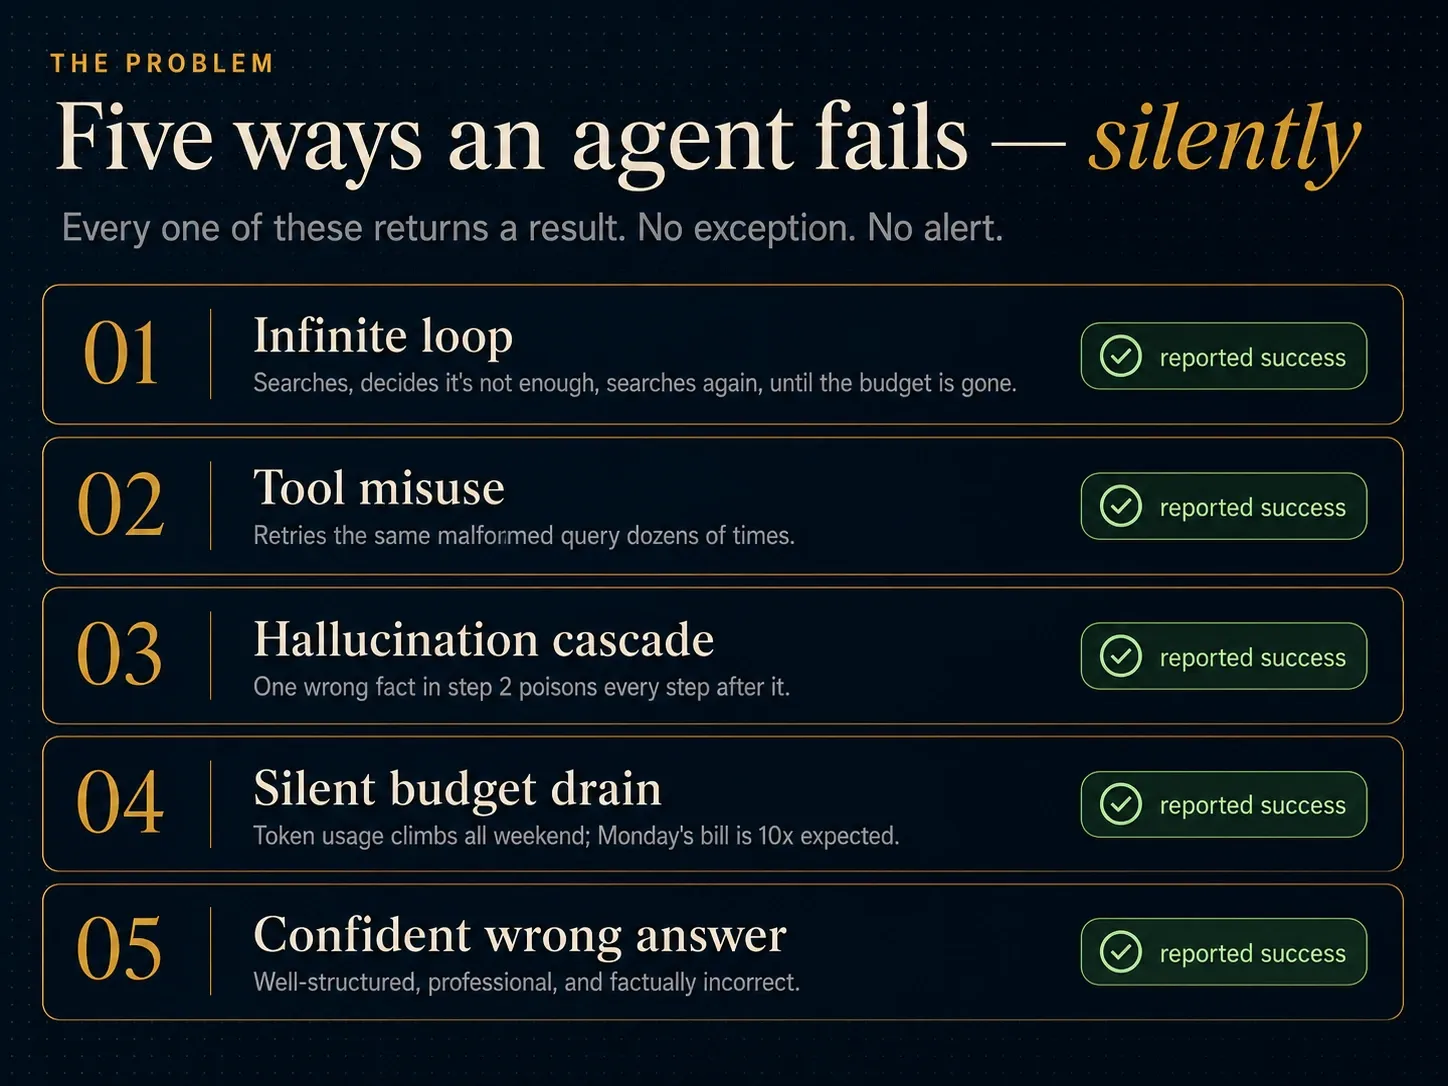
The infinite loop. An agent is tasked with researching a topic. It calls a search tool, gets a result, decides the result is insufficient, calls the search tool again with a slightly different query, decides that result is also insufficient, and repeats — indefinitely. Without token-usage monitoring and a max-iteration safeguard, this runs until a timeout kills it or your API budget is exhausted.
Tool misuse. An agent is given access to a database query tool. It constructs a query with a subtle parameter error — perhaps passing a string where an integer is expected. The tool returns an error. The agent, reasoning that it should retry, constructs another query with the same error in a slightly different form. This repeats across dozens of calls. Without tool-call logging, you see only that the agent failed; you don't know why.
Mid-chain hallucination cascade. An agent reasoning through a multi-step task hallucinates a fact in step 2. Every subsequent step is built on that incorrect assumption. The final output is wrong, but confidently presented. The hallucination is invisible without tracing the full reasoning chain — you can't identify step 2 as the failure point without seeing step 2.
Silent budget drain. An agent deployed on a Friday begins receiving unusual inputs that cause it to generate unusually long responses. Token usage climbs steadily through Saturday and Sunday. No alert fires, because nobody set one. On Monday morning, the cost report shows a weekend spend ten times higher than expected.
The confident wrong answer. An agent returns a well-structured, professional response to a user query. The response is factually incorrect. No error was thrown. No metric was breached. The failure is only discovered when a downstream human or system acts on the wrong information. Without output evaluation, there is no signal that anything went wrong.
Notice what these have in common: in almost every case, the system reported success. The technical execution was fine. The failure was semantic, or financial, or behavioral — exactly the kind of thing traditional monitoring was never built to see.
Those are the three classes every silent failure falls into, and each slips past your dashboards for a different reason:
| Failure class | What's actually broken | Examples above | What traditional monitoring sees |
|---|---|---|---|
| Semantic | The answer is wrong, incomplete, or misaligned with intent | Hallucination cascade · confident wrong answer | Nothing — no exception, no failed status code |
| Financial | The run completes, but costs far more than it should | Infinite loop · silent budget drain | A cost spike — noticed after the money is gone |
| Behavioral | The agent takes wrong or pointlessly repeated actions | Tool misuse | Success — the tool call eventually "returned" |
Why your existing monitoring won't catch this
You already monitor your software. You have dashboards, error rates, latency alerts. So why doesn't that machinery catch the failures above?
Because traditional software follows deterministic, predictable code paths. A web request comes in, hits a route handler, queries a database, formats a response, and returns. Given the same input, the system takes the same path. Tracing that path is straightforward: you instrument known functions and services, and the trace reflects what you expect.
AI agents work differently. An agent doesn't follow a fixed path — it reasons. Given a user request, it decides what to do next, which tool to call, what to say, whether to delegate to another agent. The path through the system is not known in advance; it emerges from the model's output at runtime. That breaks several assumptions your tooling is built on.
| Dimension | Traditional software | AI agents |
|---|---|---|
| Execution path | Deterministic — the same input takes the same path | Emerges at runtime from the model's reasoning |
| Core computation | Inspectable functions, call stacks, internal state | A black-box LLM call — only inputs and outputs are visible |
| Control & tool flow | Fixed and known in advance | Decided dynamically; the trace's shape varies per run |
| How it fails | Loudly — exceptions, non-200s, crashes | Silently — a confident, well-formed, wrong answer |
| Across components | Known service boundaries | Agents coordinating; unclear which one caused the bad output |
Non-determinism. The same prompt can produce different reasoning chains on different runs. An agent that worked perfectly yesterday might take a completely different sequence of steps today, leading to a different outcome. Traditional traces assume the path is reproducible — for agents, it often isn't.
Black-box LLM calls. The core computation — the LLM call itself — is entirely opaque. You send in a prompt, you get back a response. There are no function names, no call stacks, no internal state to inspect. The model's reasoning process is not accessible. You can only observe its inputs and outputs.
Dynamic tool use. Agents decide which tools to call at runtime, based on what the model reasons is appropriate. A traditional trace has a fixed shape; an agent trace has a shape that depends on the model's decisions. Instrumenting a fixed set of functions doesn't capture what an agent does if those functions are called in unexpected combinations, or not at all.
Semantic failures. When a traditional system fails, it usually fails loudly — an exception is thrown, a non-200 status code is returned, a process crashes. Agents can fail silently. The agent completes successfully from a technical standpoint but returns an answer that is factually wrong, incomplete, or subtly misaligned with what the user asked. No error is thrown. No alert fires. The failure only surfaces when a human notices the bad output — if they notice at all.
Multi-agent complexity. As systems grow to include multiple agents coordinating with each other, the problem compounds. Which agent in a pipeline caused the bad output? What context was passed between them? What did each agent see when it made its decision? These are hard questions without end-to-end tracing designed for agentic systems.
All of these share a common root:
AI agents produce outcomes through a reasoning process you cannot inspect.
In traditional software, the internal state of a system is always derivable — it is the code, executing deterministically on known inputs. If something breaks, you can read the code, step through the call stack, and find the line responsible. An LLM has no inspectable internal state. It takes a prompt and produces a response, and the chain of reasoning that connects the two is inaccessible. When an agent fails, even catastrophically, there is no call stack to read. There is only what went in and what came out — and if the failure is semantic, even that signal is absent.
So the standard debugging loop — something broke, read the code, find the cause — does not work for agents. You cannot read the model. You can only observe its behavior: the inputs it received, the decisions it made, the tools it invoked, the outputs it produced. The core challenge of agent observability is building a complete record of that behavior, at every level of granularity, so that when something goes wrong, the evidence already exists.
So what is observability, really?
Step back for the working definition. Observability is two words — observe and ability — and that's almost the whole idea:
Observability is the ability to understand the internal state of a system from the outside: to observe what it is doing and, crucially, why.
Without it, troubleshooting is guesswork — you act on assumptions about what's happening inside the system rather than evidence. With it, you can find the root cause of a failure instead of speculating about it.
In traditional software, observability rests on three kinds of data:
- Logs are timestamped, event-level records of what happened — a query ran, a user authenticated, a function threw an exception. They're the most granular signal, and they're how you reconstruct exactly what happened, and in what order, after the fact.
- Metrics are numeric measurements over time — request latency, error rate, memory usage, throughput. They're cheap to store and ideal for dashboards and alerts. They tell you that something is wrong, fast, even when they can't tell you why.
- Traces follow a single request as it moves through a system, linking together spans (individual units of work, like a database call or an API request) to show the full path from start to finish. They're the key to understanding latency and failure across many services.
One distinction worth keeping straight: monitoring is watching known signals — you set a threshold ("alert me if error rate exceeds 1%") and wait for it to be crossed. Observability is broader: the property that lets you ask arbitrary questions about a system's internal state, including ones you didn't think to ask when you built it. Monitoring uses the data observability produces. You need both.
These fundamentals still apply to agents. They're just not enough on their own.
The Agent Observability Stack: four layers of behavior
Since you cannot inspect the model's reasoning directly, you reconstruct it from the outside: every input it saw, every decision it made visible through an output, every tool it invoked, every response it generated. Assembled in sequence, these observations become a full trace of the agent's reasoning chain — the closest approximation to a call stack that's possible for a non-deterministic system. You still use logs, metrics, and traces; you just extend them to capture what matters in an agentic context.
The cleanest way to think about what to capture is as a stack of four nested layers — from the atomic LLM call at the bottom up to the whole session — with evaluation cutting across all of them.
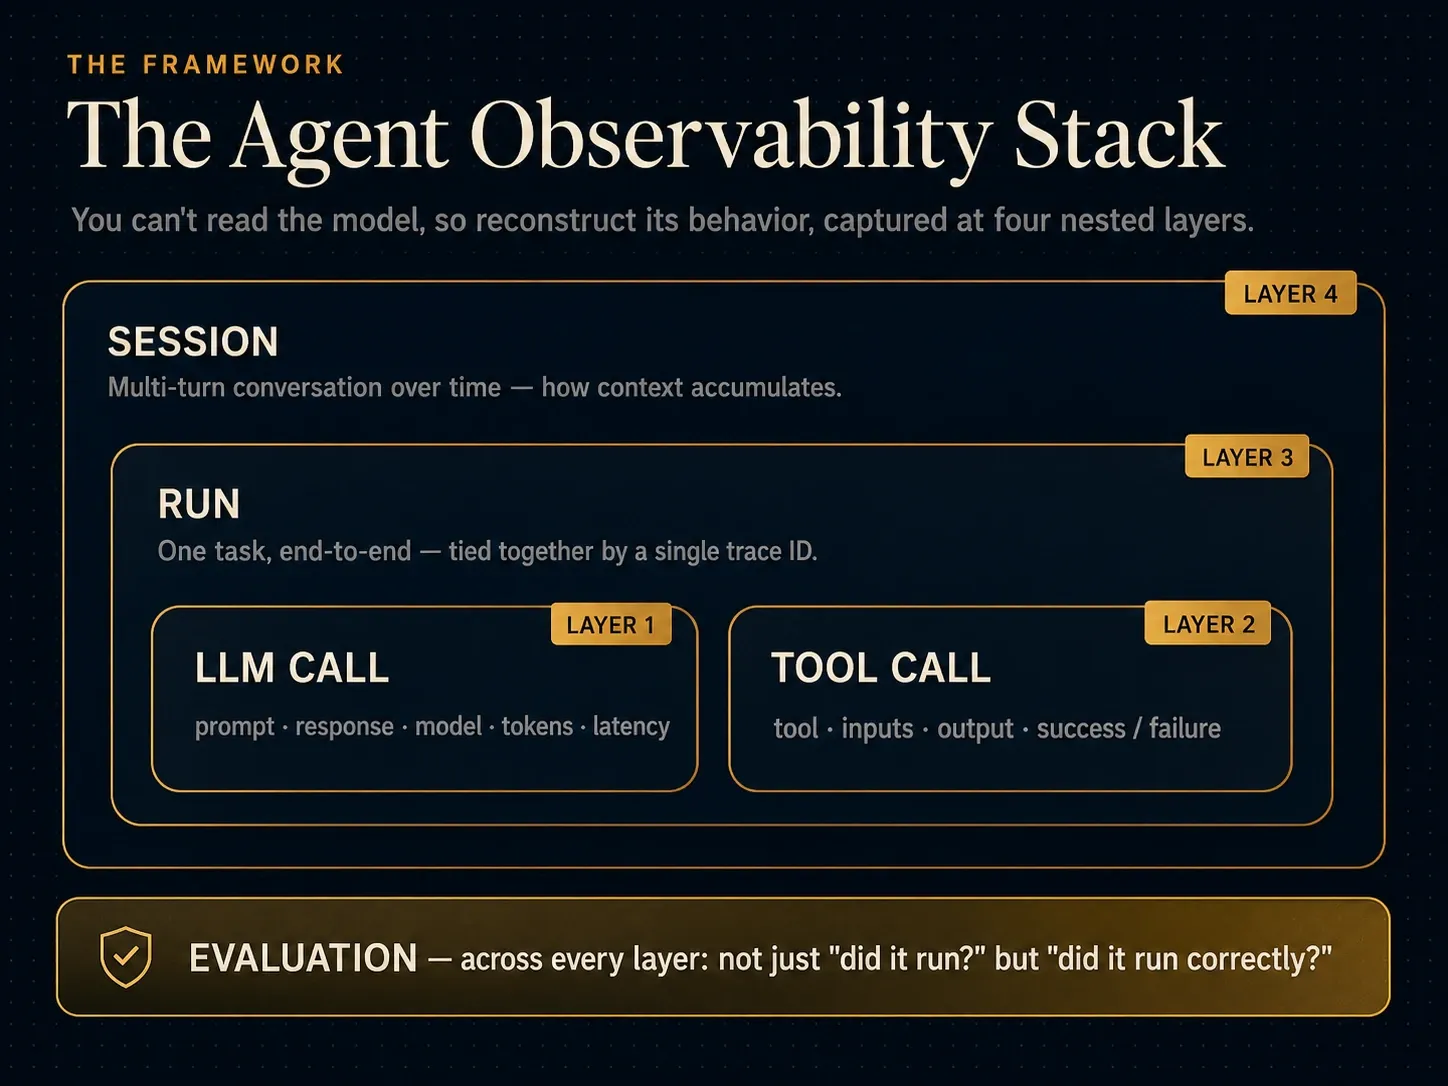
Layer 1 — the LLM call is the atomic unit of an agent's work. At minimum, every LLM call should be logged with the full prompt sent to the model, the full response received, the model and version used, the token counts (input, output, cached), and the latency. Token counts matter especially — they are the primary driver of cost, and runaway token usage is one of the most common failure modes in production.
Layer 2 — the tool call is where agents touch the outside world — running code, querying databases, calling APIs, reading files. Each should be traced with which tool was invoked, what inputs were passed, what output came back, and whether it succeeded or failed. Tool-call logs are often where the most diagnostically useful information lives, because they show what the agent actually did, not just what it said.
Layer 3 — the run is the top-level unit of work: the full sequence of steps from receiving a user input to producing a final output. A run trace ties together all the LLM calls and tool calls in a single task, making the full reasoning chain legible. Without run-level tracing, you have a pile of disconnected events instead of a coherent story.
Layer 4 — the session captures multi-turn conversations over time, showing how context accumulates and how the agent's behavior shifts as the conversation evolves. This matters most for conversational agents, where the history is part of what the model sees on every turn.
The cross-cutting layer: evaluation
Traditional observability answers one question: did the system run? Agent observability has to answer a second: did it run correctly?
That's the evaluation dimension, and it has no equivalent in traditional monitoring. Evaluation asks whether the agent's outputs are accurate, relevant, helpful, and aligned with intended behavior. It takes several forms: human review of a sample of outputs, automated checks using an LLM as a judge, comparison against golden datasets of known-good answers, or user-feedback signals like thumbs up/down.
The key shift: evaluation is not a one-time offline exercise you run before launch. In production, it's an ongoing observability signal — as important as error rate or latency.
How to build it, incrementally
Observability can feel overwhelming to add to a system that's already in production. The instinct is to wait until things break badly enough to justify the investment. Don't.
The time to add observability is before you need it — because when you need it, you need it immediately.
The path below is deliberately incremental. Each step delivers standalone value, so you can stop at any point and still be better off than before.
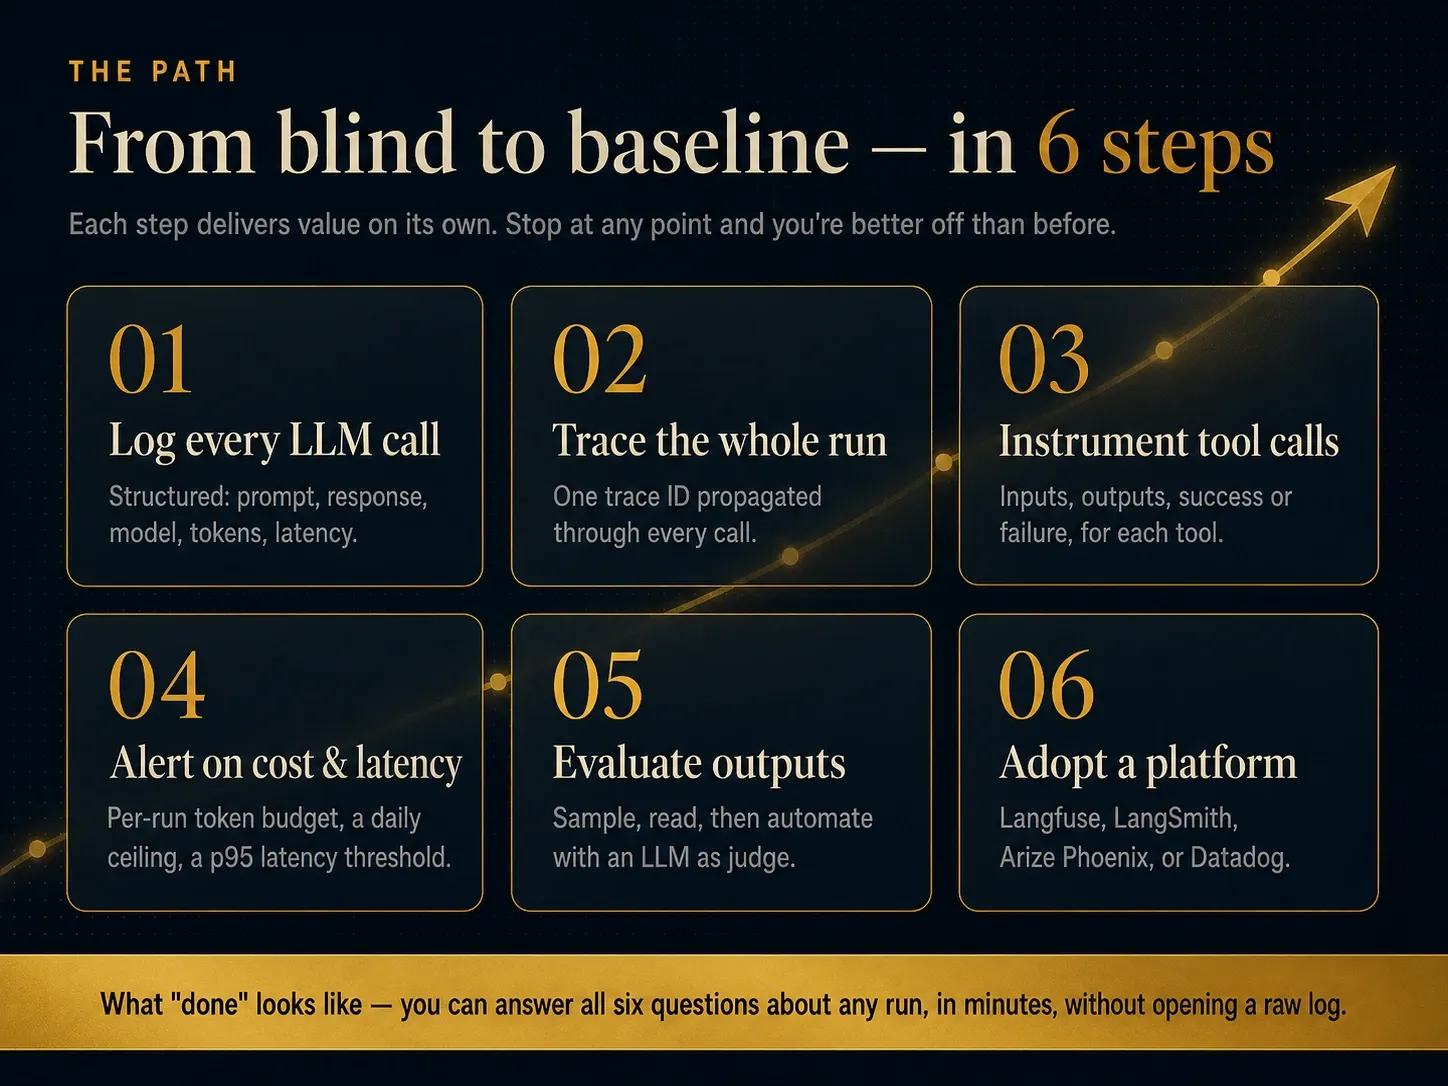
Step 1 — Log every LLM call. This is the non-negotiable baseline. Every call to an LLM — whether a simple completion or one turn of a complex agent loop — should produce a structured (JSON, not plain text) log entry containing:
- The full prompt sent to the model (system message, conversation history, and any retrieved context — what the model actually saw is often the single most valuable piece of evidence)
- The full response received
- The model name and version (e.g.
claude-sonnet-4-6,gpt-4o) - Token counts: input, output, and cached if applicable
- Wall-clock latency from request to response
- A timestamp and a unique request ID
Structured logging is what lets downstream tools filter and aggregate on specific fields — model, token count, tool name, error type — at scale. This step alone gives you cost visibility, a basic audit trail, and the raw material for everything that follows. If you do nothing else, do this.
Step 2 — Add run-level tracing. Individual call logs are disconnected events; run-level tracing connects them into a story. Assign a unique trace ID at the start of each agent run and propagate it through every LLM call and tool call involved in handling that request. Look up the trace ID later and you see the entire sequence: what the agent was asked, what it decided, what tools it called, what they returned, and what it ultimately said. This is the step that turns debugging from "something went wrong somewhere" into "here is exactly what happened, in order."
Step 3 — Instrument tool calls explicitly. Tool calls deserve their own log entries, separate from LLM logs. For each invocation, record the tool name, the inputs passed (structured, not stringified), the output returned, success/failure status with the error message if it failed, and the tool's own latency. This matters because many agent failures are tool failures — the model reasoned correctly but the tool misbehaved, returned unexpected data, or failed silently. Without explicit tool logging, those look identical to reasoning failures.
Step 4 — Set cost and latency alerts. Before your system sees real traffic, define what "normal" looks like and alert when you deviate from it:
- A per-run token budget: if a single run consumes more than X tokens, fire an alert. This catches infinite loops and runaway reasoning before they get expensive.
- A daily spend ceiling: an absolute cap that triggers an alert — or a hard stop — when crossed.
- A latency threshold: if p95 latency for a run exceeds your SLA, you want to know.
Setting good thresholds needs some data, which is why steps 1–3 come first. Even rough initial values beat none; tune them as you learn your system's baseline.
Step 5 — Start evaluating outputs, even informally. Metrics tell you whether the system ran; evaluation tells you whether it ran correctly. Start simple: sample 5–10% of agent outputs and have a human read them. Flag responses that are wrong, incomplete, off-topic, or otherwise problematic, and keep a running log. After a few weeks, patterns emerge — input types that reliably cause bad outputs, edge cases the agent handles poorly, prompt formulations that confuse the model. Once you have enough labeled good/bad examples, automate: LLM-as-judge for common quality dimensions, rule-based checks for known failure modes, a regression suite built from past failures. But the informal human review is where you start, and it catches things no automated system would.
Step 6 — Adopt a dedicated observability platform. Once baseline instrumentation is in place — LLM logs, run traces, tool-call logs — the volume and complexity will outgrow hand-built dashboards and raw log files. That's the point to integrate a purpose-built platform (see the landscape below). Whichever you choose, wire it in properly, not as an afterthought: make sure trace IDs propagate correctly, build the dashboards you'll actually look at, and configure alerts through the platform rather than ad hoc scripts.
What "done" looks like. Remember the six questions from the start of this article? You've reached a solid baseline when you can answer every one of them — What did the user ask? What did the agent do, step by step? What did each tool call receive and return? How many tokens did it cost? How long did it take? Did the output look correct? — for any run, within minutes, without opening a raw log file.
The tooling landscape
You don't have to build this from scratch. The ecosystem matured fast — what was a handful of side projects in 2023 is now a crowded, well-funded category. (A telling signal: in January 2026 the database company ClickHouse acquired Langfuse, the open-source leader, as part of a $400M raise — observability data is the AI product now.) Four groups are worth knowing.
Open-source, self-hostable. The default starting point if you want control of your data.
| Tool | Best for | What you get |
|---|---|---|
| Langfuse | The strong default if you're not tied to a framework | MIT-licensed, framework-agnostic leader: tracing, prompt management with a playground, evaluation (LLM-as-judge, user feedback, custom metrics), one-command self-host. Fortune-500 adoption; ClickHouse-backed but committed to staying open. |
| Arize Phoenix | Teams where evaluation is a standing practice | Evaluation-first and free to self-host: 50+ research-backed metrics (faithfulness, relevance, toxicity, hallucination), drift detection, RAG-quality analysis. Commercial AX covers scale. |
| Comet Opik | Auto-capturing every agent step | Open-source tracing + evaluation that records prompt chains and tool calls automatically, with AI-assisted prompt optimization. A fast-rising newer entrant. |
| OpenLLMetry | The least lock-in | Pure OpenTelemetry instrumentation (by Traceloop) that pipes LLM and agent traces into whatever backend you already run — Datadog, Grafana, Honeycomb, New Relic. |
Managed / commercial. Less ops, more polish, usage-based pricing.
| Tool | Best for | What you get |
|---|---|---|
| LangSmith | Teams on LangChain/LangGraph | Built by the LangChain team — the path of least resistance there. Renders every run as a visual graph of reasoning steps, tool calls, and multi-agent hand-offs. |
| Braintrust | The fastest production-to-fix loop | Evaluation-native: production failures become eval cases and CI gates block regressions before release. |
| Weights & Biases Weave | Teams already training on W&B | LLM tracing and evaluation that extends Weights & Biases. |
| Helicone | Fast cost/latency visibility | Proxy-based, minimal-code quick start; less depth than dedicated tracing. |
Your existing APM. If the team already lives in one, this is the lowest-friction route — no new vendor, and LLM signals sit next to your infrastructure metrics.
| Tool | Best for | What you get |
|---|---|---|
| Datadog LLM Observability | Teams already on Datadog | Auto-instruments OpenAI, Anthropic, Bedrock, LangChain, and Google's Agent Development Kit, with built-in hallucination evaluations and prompt-injection scanning. |
| New Relic / Grafana | Teams on those stacks | Comparable LLM/agent observability features. |
The emerging standard — OpenTelemetry GenAI. OTEL now defines GenAI semantic conventions: standardized attribute names for LLM calls, agent and framework spans, and MCP tool calls — model, token counts, tool invocations, and more. They're still in development (not yet marked stable as of mid-2026), but vendors already emit them (Datadog since OTel v1.37; Arize's OpenInference is converging with them). Instrument against these conventions and you keep your data portable no matter which backend you pick.
Choosing, in one line: start with one platform — Langfuse if you want open-source and self-hosting, LangSmith if you're on LangChain, Datadog if you're already there — and add a dedicated evaluation tool (Phoenix, Braintrust, or Opik) once evaluation becomes a real practice.
Challenges to keep in mind
Observability for agents has its own complications:
- Storage cost. Prompts and responses are large. Logging every call in full, at high volume, generates significant storage. You'll need deliberate choices about what to log in full versus summarize or sample.
- Privacy and PII. User messages often contain sensitive information, and responses may repeat or synthesize it. Logging everything means storing sensitive data — which creates compliance obligations. You need a clear policy: redaction, retention limits, access controls.
- High cardinality. Every run generates unique trace IDs, tool inputs, and prompt contents. Metrics systems struggle with high cardinality (many unique label combinations) and can become slow or expensive. Choose metric dimensions carefully.
- Instrumentation overhead. Observability adds latency. Synchronous logging can slow your agent's responses — use asynchronous logging where possible, and measure the overhead of your instrumentation.
- Evaluating probabilistic outputs. There's rarely a single ground truth for an agent's output. Evaluation requires judgment, which is expensive at scale. LLM-as-judge helps but has its own error rate — calibrate it against human judgment regularly.
- A fast-moving ecosystem. Tools, standards, and best practices are evolving fast — platforms get acquired, and even the OpenTelemetry GenAI conventions are still stabilizing. What's standard today may shift in six months. Build on open standards (OpenTelemetry) where you can, and avoid deep lock-in to any vendor's proprietary data format.
Conclusion
AI agents introduce a new class of software problem: systems that are powerful, flexible, and deeply opaque, capable of failing in ways traditional monitoring was never designed to detect — silently, semantically, and expensively.
Observability is how you take back control. Not by making agents deterministic — that would defeat the purpose — but by making their behavior visible. When you can see what an agent is doing, why it's doing it, and whether the outcome was any good, you can debug failures, catch regressions, and improve the system with confidence.
The fundamentals — logs, metrics, traces — still apply. For agents they're a starting point, not a destination. The destination is a system where every reasoning step is traceable, every tool call is auditable, every output is evaluated, and every anomaly triggers an alert before a user has to report it.
That level of observability isn't built in a day. But it is built incrementally, starting with a single structured log entry for your next LLM call.
For any agent running in production, the question was never whether you can afford to invest in observability. It's whether you can afford to keep flying blind.